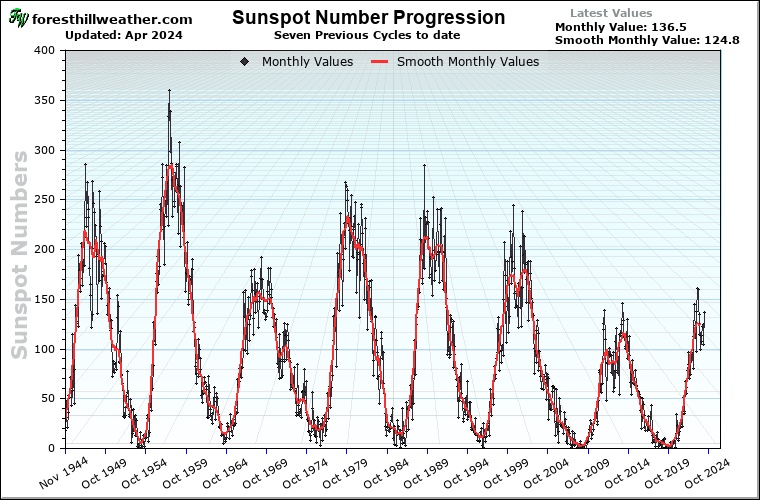
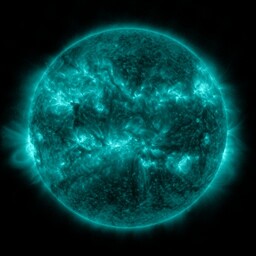
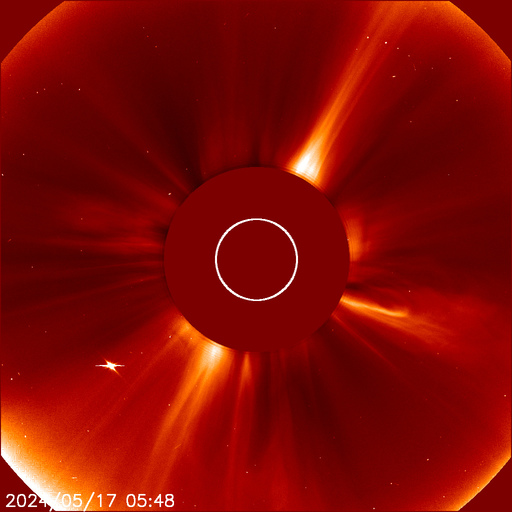
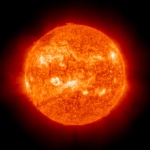
Space Weather Daily Solar Data, Solar flares Past 24 Hour Graph
| ( Latest Alart ) - Issue Time: 2024 Apr 26 2300 UTC - Read More |
|
EXTENDED WARNING: Geomagnetic K-index of 4 expected |
|
|
Joint USAF/NOAA Solar Region Summary
Solar Region Summary Number 118 Issued at 0030Z on 27 Apr 2024. This report is compiled from data received at SWO on 26 Apr
Ⅰ. Regions with Sunspots. Locations Valid at 26/2400Z
| Nmbr |
Location |
Lo |
Area |
Z |
LL |
NN |
Mag Type |
| 3639 |
N30W90 |
215 |
0010 |
Axx |
01 |
01 |
Alpha |
| 3644 |
N13W57 |
182 |
0040 |
Hsx |
06 |
02 |
Alpha |
| 3646 |
N21W53 |
178 |
0090 |
Cao |
10 |
05 |
Beta |
| 3648 |
N18W72 |
197 |
0080 |
Dri |
09 |
06 |
Beta-Gamma |
| 3652 |
N14W42 |
167 |
0070 |
Hsx |
02 |
01 |
Alpha |
| 3654 |
S08W08 |
133 |
0160 |
Eai |
12 |
19 |
Beta-Gamma |
| 3655 |
S27W03 |
128 |
0060 |
Hsx |
09 |
01 |
Alpha |
| 3656 |
S12E07 |
118 |
0010 |
Axx |
01 |
01 |
Alpha |
| 3657 |
S15W19 |
144 |
0010 |
Bxo |
02 |
03 |
Beta |
| 3658 |
S23W60 |
185 |
0060 |
Dro |
06 |
04 |
Beta |
| 3659 |
S13E20 |
105 |
0010 |
Axx |
01 |
01 |
Alpha |
|
|
ⅠA. H-alpha Plages without Spots. Locations Valid at 26/2400Z Apr
| Number |
Location |
Lo |
| 3643 |
S12W87 |
212 |
| 3647 |
S13W92 |
217 |
| 3650 |
S11W73 |
198 |
| 3651 |
N09W63 |
187 |
| 3653 |
N03W15 |
140 |
|
|
ⅠⅠ. Regions Due to Return 27 Apr to 29 Apr
| Number |
Lat |
Lo |
| 3628 |
N08 |
019 |
|
|
Region Flare Probabilities for Apr 27, 2024
| Region |
Class C |
M |
X |
P |
| 3639 |
5% |
1% |
1% |
1% |
| 3644 |
10% |
1% |
1% |
1% |
| 3645 |
0% |
0% |
0% |
0% |
| 3646 |
25% |
5% |
1% |
1% |
| 3648 |
40% |
10% |
1% |
1% |
| 3652 |
10% |
1% |
1% |
1% |
| 3654 |
60% |
20% |
5% |
1% |
| 3655 |
10% |
1% |
1% |
1% |
| 3656 |
5% |
1% |
1% |
1% |
| 3657 |
10% |
1% |
1% |
1% |
| 3658 |
25% |
5% |
1% |
1% |
| 3659 |
5% |
1% |
1% |
1% |
|
|
Event probabilities - Issued: Apr 27 to Apr 29
|
Apr 27 |
Apr 28 |
Apr 29 |
| Class: C-flare |
99% |
99% |
95% |
| Class: M-flare |
75% |
55% |
35% |
| Class: X-flare |
15% |
5% |
5% |
| Proton |
15% |
5% |
1% |
| PCAF Updated: Friday, 26 Apr 2024
UTC |
| Polar Cap Absorption FCST | green |
|
|
| Last 30 Days Daily Solar Data - Issued: 0825 UT 27 Apr 2024 |
| Prepared by the U.S. Dept. of Commerce, NOAA, Space Weather Prediction Center |
| CURRENT TIME |
|
|
|
|
|
|
|
|
Solar |
X-Ray |
-----Flares----- |
|
Flux |
Sunspot |
10E-6 |
New |
Bkgd |
X-Ray |
Optical |
|
10.7cm |
Number |
Hemis |
Regions |
Flux |
C |
M |
X |
S |
1 |
2 |
3 |
| Apr-26-2024 |
153 |
154 |
600 |
0 |
* |
6 |
0 |
0 |
6 |
0 |
0 |
0 |
| Apr-25-2024 |
167 |
196 |
1070 |
1 |
* |
9 |
3 |
0 |
4 |
0 |
0 |
0 |
| Apr-24-2024 |
199 |
283 |
1500 |
1 |
* |
11 |
5 |
0 |
12 |
1 |
1 |
0 |
| Apr-23-2024 |
219 |
282 |
1470 |
0 |
* |
9 |
3 |
0 |
21 |
4 |
0 |
0 |
| Apr-22-2024 |
227 |
283 |
1280 |
1 |
* |
8 |
7 |
0 |
19 |
3 |
0 |
0 |
| Apr-21-2024 |
217 |
283 |
1340 |
5 |
* |
6 |
3 |
0 |
16 |
1 |
0 |
0 |
| Apr-20-2024 |
210 |
240 |
1200 |
0 |
* |
12 |
0 |
0 |
14 |
3 |
0 |
0 |
| Apr-19-2024 |
213 |
243 |
1120 |
3 |
* |
11 |
2 |
0 |
11 |
1 |
0 |
0 |
| Apr-18-2024 |
227 |
247 |
1380 |
2 |
* |
3 |
3 |
0 |
11 |
2 |
0 |
0 |
| Apr-17-2024 |
217 |
199 |
1150 |
2 |
* |
12 |
1 |
0 |
9 |
1 |
1 |
0 |
| Apr-16-2024 |
199 |
176 |
1200 |
1 |
* |
4 |
1 |
0 |
0 |
0 |
1 |
0 |
| Apr-15-2024 |
192 |
193 |
1070 |
2 |
* |
13 |
8 |
0 |
12 |
5 |
0 |
0 |
| Apr-14-2024 |
178 |
152 |
770 |
3 |
* |
13 |
1 |
0 |
12 |
1 |
0 |
0 |
| Apr-13-2024 |
161 |
115 |
750 |
2 |
* |
8 |
1 |
0 |
3 |
0 |
0 |
0 |
| Apr-12-2024 |
152 |
83 |
570 |
0 |
* |
8 |
0 |
0 |
7 |
0 |
0 |
0 |
| Apr-11-2024 |
144 |
81 |
560 |
1 |
* |
10 |
1 |
0 |
4 |
0 |
0 |
0 |
| Apr-10-2024 |
131 |
54 |
410 |
1 |
* |
11 |
0 |
0 |
3 |
0 |
0 |
0 |
| Apr-09-2024 |
124 |
64 |
405 |
0 |
* |
2 |
0 |
0 |
0 |
0 |
0 |
0 |
| Apr-08-2024 |
125 |
79 |
470 |
1 |
* |
2 |
0 |
0 |
0 |
0 |
0 |
0 |
| Apr-07-2024 |
125 |
79 |
380 |
0 |
* |
2 |
0 |
0 |
1 |
0 |
0 |
0 |
| Apr-06-2024 |
123 |
71 |
400 |
1 |
* |
1 |
0 |
0 |
0 |
0 |
0 |
0 |
| Apr-05-2024 |
121 |
81 |
310 |
3 |
* |
5 |
0 |
0 |
0 |
0 |
0 |
0 |
| Apr-04-2024 |
114 |
47 |
170 |
1 |
* |
0 |
0 |
0 |
1 |
0 |
0 |
0 |
| Apr-03-2024 |
112 |
45 |
101 |
1 |
* |
0 |
0 |
0 |
0 |
0 |
0 |
0 |
| Apr-02-2024 |
113 |
35 |
76 |
1 |
* |
0 |
0 |
0 |
0 |
0 |
0 |
0 |
| Apr-01-2024 |
125 |
50 |
112 |
1 |
* |
0 |
1 |
0 |
2 |
0 |
0 |
0 |
| Mar-31-2024 |
134 |
50 |
110 |
1 |
* |
6 |
0 |
0 |
0 |
0 |
0 |
0 |
| Mar-30-2024 |
140 |
60 |
930 |
1 |
* |
8 |
1 |
0 |
7 |
0 |
0 |
0 |
| Mar-29-2024 |
167 |
79 |
1090 |
0 |
* |
12 |
2 |
0 |
15 |
1 |
0 |
0 |
| Mar-28-2024 |
173 |
101 |
1150 |
0 |
* |
8 |
3 |
1 |
6 |
3 |
1 |
1 |
|
|
Space Weather links:
|
|
Related Links:
|
|
|
|
|
powered by Cumulus v1.9.3 (1059)
Ambient Weather VWS v14.00
Weather-Display (10.37S-(b58))
Virtual VP software
Top
Website Map
Copyright © 2007 - 2024 Foresthillweather.com
Never base important decisions on this or any weather information obtained from the Internet


 Air Quality


