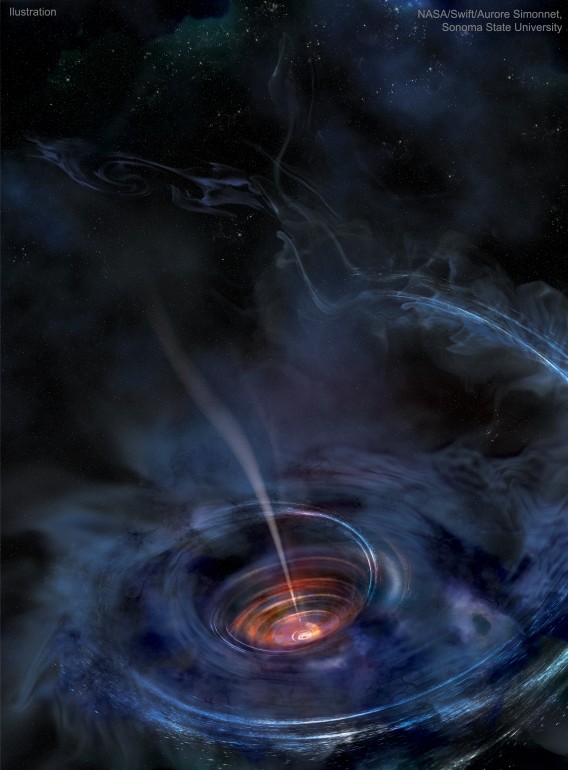


EXTENDED WARNING: Geomagnetic K-index of 4 expected
| Weather Conditions Clear skies, Dry Visibility: 10 miles |
|
|
This Icon is a Combination of Blue Canyon Airport and Data From foresthillweather.com |
|

| Advisories / Alerts |
| Severe Wx Summary! | ||||||||
 |
||||||||
|
||||||||
|
||||||||
 |
||||||||
| Sat, Apr 27, 2024 - 1:21am | ||||||||
|
|
|
|
|
|
Info Links
|
|||||
|
|
|
|
|
|||||
 |


| Joint USAF/NOAA Solar Geophysical Activity Report and Forecast SDF Number 117 Issued at 2200Z on 26 Apr 2024 |
| IA. Analysis of Solar Active Regions and Activity from 25/2100Z to
26/2100Z: Solar activity has been at low levels for the past 24 hours. The largest solar event of the period was a C6 event observed at 26/0636Z from Region 3639 (N30W90). There are currently 11 numbered sunspot regions on the disk. |
| IB. Solar Activity Forecast Solar activity is expected to be moderate with a slight chance for an X-class flare on day one (27 Apr) and likely to be moderate on day two (28 Apr) and expected to be low with a chance for M-class flares on day three (29 Apr). |
| IIA. Geophysical Activity Summary 25/2100Z to 26/2100Z The geomagnetic field has been at quiet to minor storm levels for the past 24 hours. Solar wind speed reached a peak of 387 km/s at 26/0116Z. Total IMF reached 13 nT at 26/1515Z. The maximum southward component of Bz reached -11 nT at 26/1253Z. Electrons greater than 2 MeV at geosynchronous orbit reached a peak level of 825 pfu. |
| IIB. Geophysical Activity Forecast The geomagnetic field is expected to be at unsettled to active levels on day one (27 Apr), quiet to active levels on day two (28 Apr) and quiet to unsettled levels on day three (29 Apr). Protons greater than 10 Mev have a slight chance of crossing threshold on day one (27 Apr). |
Product: 3-Day Forecast - Issued: 2024 Apr 27 0030 UTC
Prepared by the U.S. Dept. of Commerce, NOAA, Space Weather Prediction Center.
Geomagnetic Activity Observation and Forecast
The greatest observed 3 hr Kp over the past 24 hours was 5 (NOAA Scale G1). The greatest expected 3 hr Kp for Apr 27-Apr 29 2024 is 4.00 (below NOAA Scale levels).
| NOAA Kp index breakdown Apr 27 to Apr 29 2024 |
|
|||||||||||||||||||||||||||||||||||||||||
|
|||||||||||||||||
| Geomagnetic Activity Probabilities For - Apr 27 to Apr 29 |
|
Rationale: No G1 (Minor) or greater geomagnetic storms are expected.
Solar Radiation Activity Observation and Forecast
Solar radiation, as observed by NOAA GOES-18 over the past 24 hours, was below S-scale storm level thresholds.
| Solar Radiation Storm Forecast for Apr 27 to Apr 29 2024 |
|
Rationale: There is a slight chance for S1 (Minor) storms on 27 Apr due to the location and flare potential of multiple active regions.
Radio Blackout Activity and Forecast
No radio blackouts were observed over the past 24 hours.
| Radio Blackout Forecast for Apr 27 to Apr 29 2024 |
|
|||||||||||||||||||||||||
Rationale: R1-R2 (Minor-Moderate) radio blackouts are expected, with a slight chance for an R3 (Strong) event, on 27 Apr. R1-R2 events are likely on 28 Apr and there is a chance for R1-R2 events on 29 Apr.
| Region Flare Probabilities for Apr 27, 2024 |
|
Product: 27 day Space Weather Outlook - Issued: 2024 Apr 22 0200 UTC
|
|
|
|||||||||||||
|
|
|
|
|
|||||||
| Large Angle and Spectrometric Coronagraph (LASCO). | Real-Time Solar Wind data broadcast from NASA's ACE satellite. |
|
|||||||
Instruments on board the NOAA Polar-orbiting Operational Environmental Satellite (POES) continually monitor the power flux carried by the protons and electrons that produce aurora in the atmosphere. SWPC has developed a technique that uses the power flux observations obtained during a single pass of the satellite over a polar region (which takes about 25 minutes) to estimate the total power deposited in an entire polar region by these auroral particles. The power input estimate is converted to an auroral activity index that ranges from 1 to 10. |
|
|||||||||||||||||||
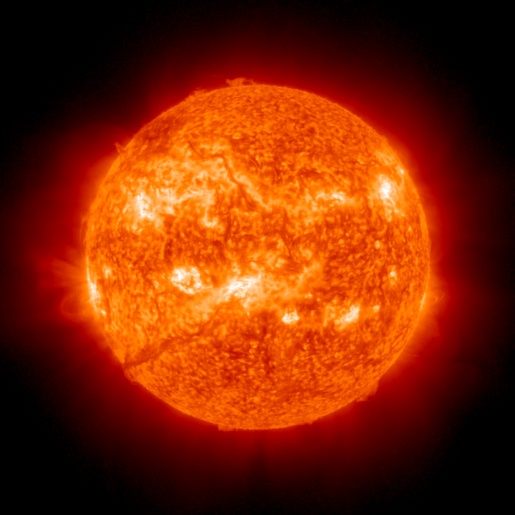
The sun is constantly monitored for sun spots and coronal mass ejections. EIT (Extreme ultraviolet Imaging Telescope) images the solar atmosphere at several wavelengths, and therefore, shows solar material at different temperatures. In the images taken at 304 Angstrom the bright material is at 60,000 to 80,000 degrees Kelvin. In those taken at 171 Angstrom, at 1 million degrees. 195 Angstrom images correspond to about 1.5 million Kelvin, 284 Angstrom to 2 million degrees. The hotter the temperature, the higher you look in the solar atmosphere. |
|
|||||
|
|||||||
|
|||||||
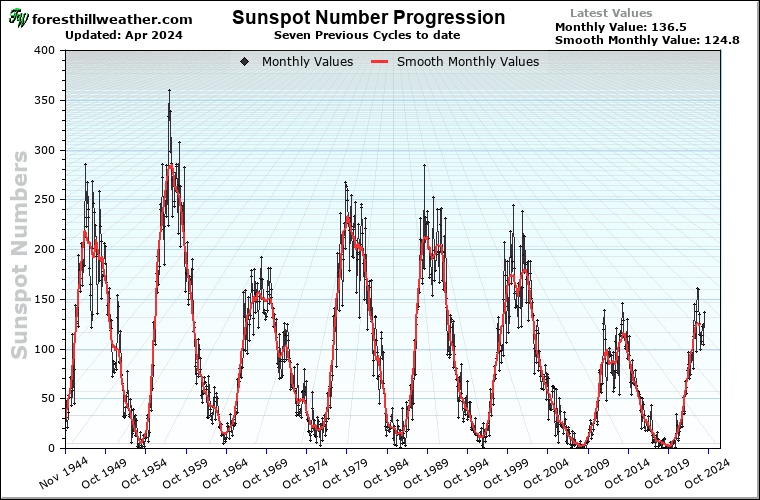
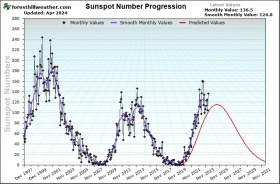
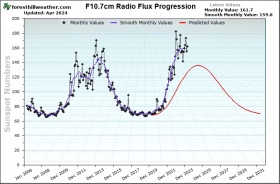
| This plot shows the Solar Cycle Sun Spot Number Progression | F10.7cm Radio Flux Progression |
- Solar Cycles Highcharts
The Solar Cycle forecast comes from the Solar Cycle Prediction Panel representing NOAA, NASA and the International Space Environmental Services (ISES). This amounts to the ‘official’ forecast for the solar cycle. The Prediction Panel forecasts the sunspot number expected for solar maximum and has predicted Cycle 25 to reach a maximum of 115 occurring in July, 2025. The error bars on this prediction mean the panel expects the cycle maximum could be between 105-125 with the peak occurring between November 2024 and March 2026.
|
|
|||||||
The D-Region Absorption Product addresses the operational impact of the solar X-ray flux and SEP events on HF radio communication. Long-range communications using high frequency (HF) radio waves (3 - 30 MHz) depend on reflection of the signals in the ionosphere. Radio waves are typically reflected near the peak of the F2 layer (~300 km altitude), but along the path to the F2 peak and back the radio wave signal suffers attenuation due to absorption by the intervening ionosphere. The D-Region Absorption Prediction model is used as guidance to understand the HF radio degradation and blackouts this can cause. |
|
| Notes: LD means "Lunar Distance." 1 LD = 384,401 km, the distance between Earth and the Moon. 1 LD also equals 0.00256 AU. MAG is the visual magnitude of the asteroid on the date of closest approach. |
| Source: Space Weather.com |
| Regulus and the Dwarf Galaxy | |||
|
|||
2024 April 26 |
|||
Explanation: In northern hemisphere spring, bright star Regulus is easy to spot above the eastern horizon. The alpha star of the constellation Leo, Regulus is the spiky star centered in this telescopic field of view. A mere 79 light-years distant, Regulus is a hot, rapidly spinning star that is known to be part of a multiple star system. Not quite lost in the glare, the fuzzy patch just below Regulus is diffuse starlight from small galaxy Leo I. Leo I is a dwarf spheroidal galaxy, a member of the Local Group of galaxies dominated by our Milky Way Galaxy and the Andromeda Galaxy (M31). About 800 thousand light-years away, Leo I is thought to be the most distant of the known small satellite galaxies orbiting the Milky Way. But dwarf galaxy Leo I has shown evidence of a supermassive black hole at its center, comparable in mass to the black hole at the center of the Milky Way. |
|||
| High Resolution Image | |||
| Tomorrow’s Image: all around eclipse | |||
| Credit & Copyright: Markus Horn | |||
| Courtesy of Astronomy Picture of the Day Index - Main Page & Astronomy Picture of the Day |

Space Weather Images and Information (excluded from copyright) courtesy of: NOAA / NWS Space Weather Prediction Center, Mauna Loa Solar Observatory (HAO/NCAR), and SOHO (ESA & NASA).
Powered by Space Weather PHP script by Mike Challis
additions by Martin of Hebrides Weather, Ken True of Saratoga Weather,
Jerry Wilkins of Southeast Lincoln Weather and Jeremy Dyde of Jerbils Weather
Ambient Weather VWS v14.00 Weather-Display (10.37S-(b58))
Virtual VP software Top Website Map Copyright © 2007 - 2024 Foresthillweather.com Never base important decisions on this or any weather information obtained from the Internet
 Air Quality


